The Shipping Industry and Malaysian Bulk Carriers
8 April 2021
Brief Overview of the Dry Bulk and Container Shipping Industry
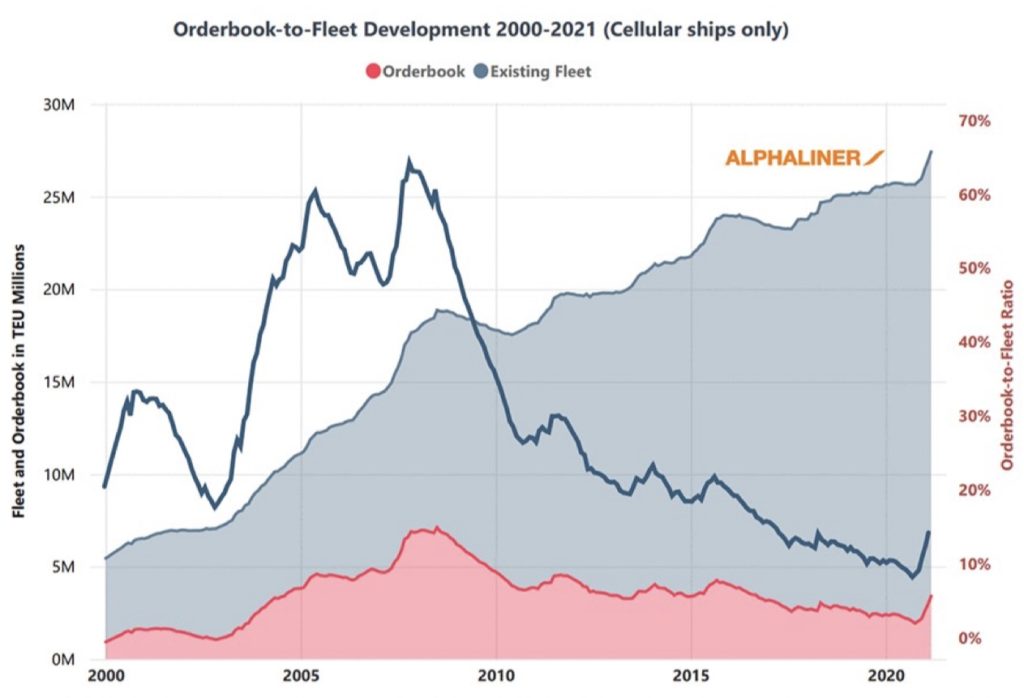
The extremely strong demand for both the container and dry bulk shipping prior to the global financial crisis (GFC) have led to aggressive capacity expansion. Orderbook for new bulkers peak in 2008 and it represented 80% of existing fleet back then. Demand slows down post-GFC while new vessels continued to be delivered. It resulted in suppressed shipping rate for almost a decade which sent some shipping companies into bankruptcies, forfeited deposit paid for new ship as well as promoted industry consolidation.
 Source: Bloomberg
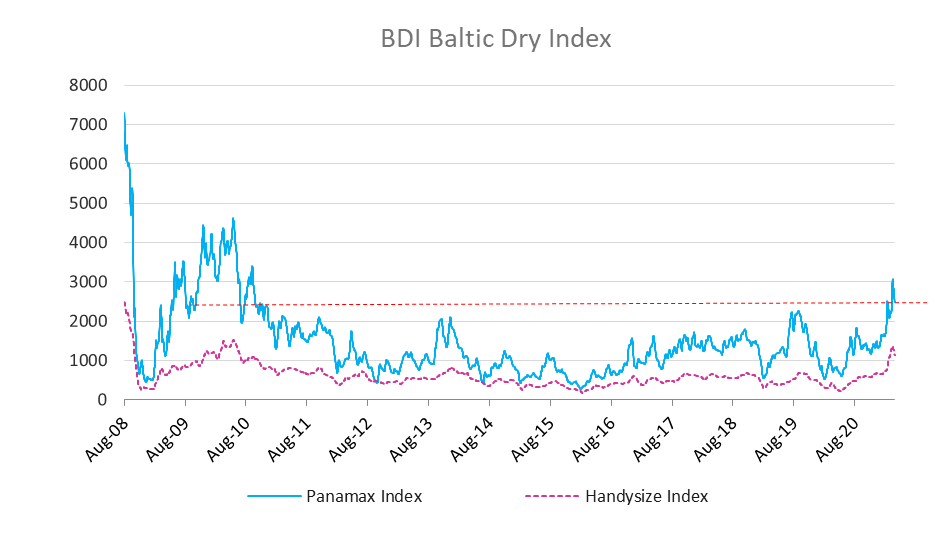
Baltic dry Index (BDI) for smaller ships (from Handysize to Panamax) has doubled since Feb’21 to decade high level. It is driven by a confluence of factors including:
strong demand recovery for grains from China following the recovery of its swine population after African Swive Flu in 2018-19;
high demand for construction materials and coal as government around the world begins to pump prime after Covid induced recession;
reduction in effective shipping and port capacity due to Covid related restriction on seafarers;
port congestions;
limited supply of new vessels being delivered;
the IMO 2020 regulation limits sulphur content in ships' fuel oil to a maximum 0.50%. The regulation has been in force globally since 1 January 2020 which significantly increased the cost of building new ship as well as upgrading old ship.
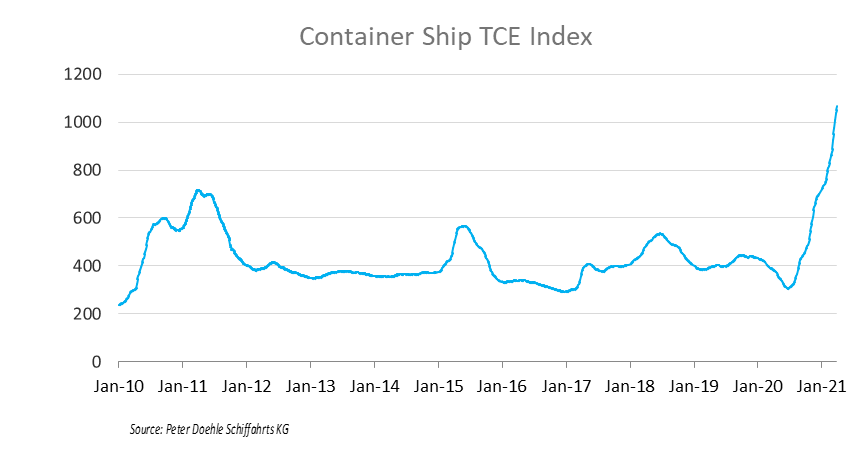
Container ship time charter equivalent (TCE) index began to move up since Jun’20 for the similar reasons cited above. In additions, the demand for containers shipping bounced back earlier can also be attributed to:
governments are fast in giving out stimulus cheques to consumers to spend;
consumers staying at home shifted their spending from services to physical goods.
Bulker’s Orderbook as a % of Existing Fleet Has Dropped Significantly
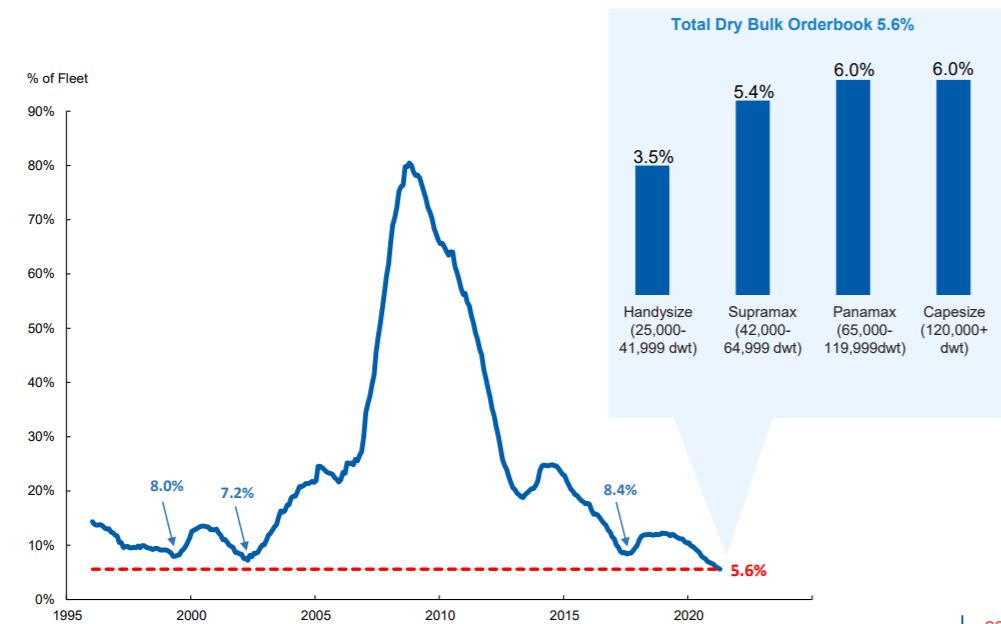
Bulkers’ orderbook-to-fleet ratio stood at multi-decade low of 5.7% of existing fleet as Feb’21 and is set to go lower due to the price differential between new builds and second-hand ships and uncertainty around environmental regulation. Furthermore, bulkers have just begun to see higher rate in Feb’21 after a decade-long of suffering which instilled certain level of capital discipline.
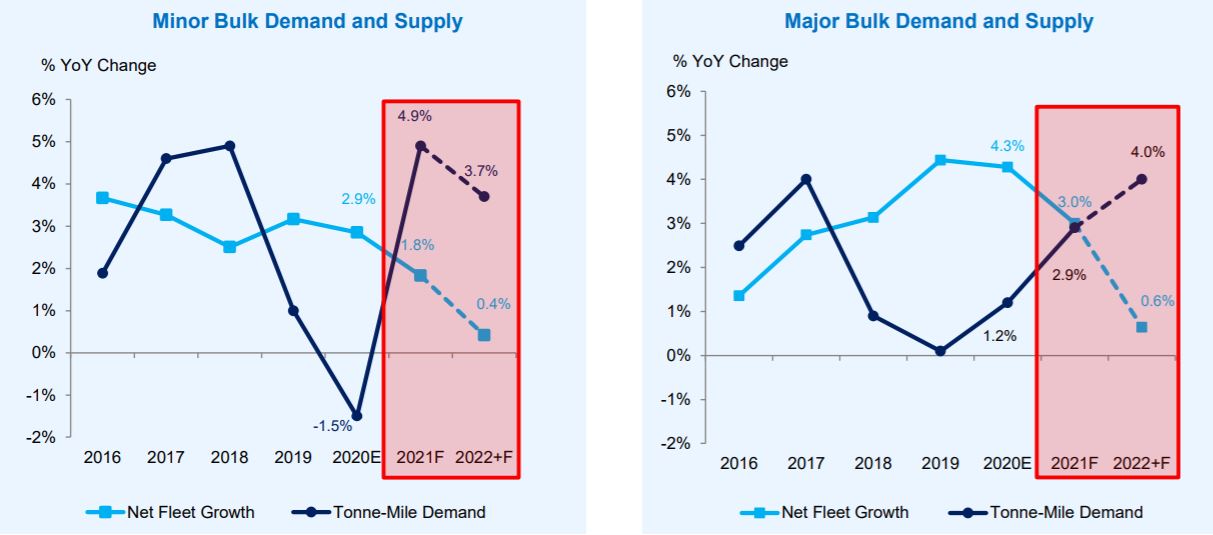
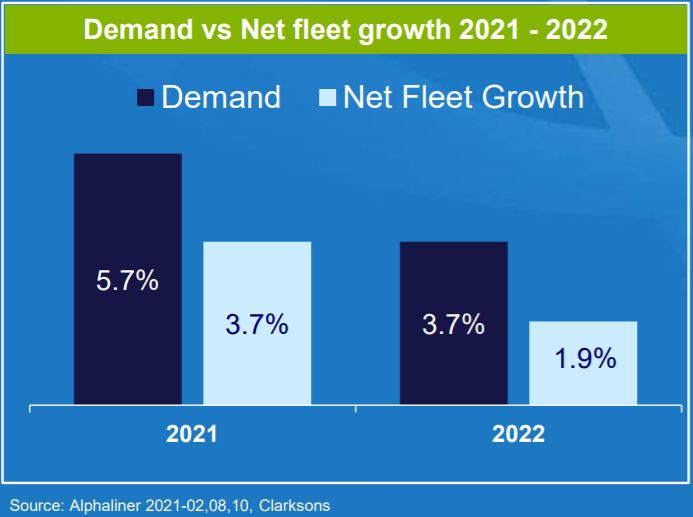
Both major bulk (larger vessel – normally used for carrying coal and iron ore) and minor bulk (smaller vessel – used for everything else) demand is expected to outstripped supply in the coming two years.
 Source: Pacific Basin; Clarkson research.
To quote Gerry Craggs, MD of Stemcor S.E.A. Pte Ltd, a leading independently run service provider for the steel industry:
We’re in the phase of fiscal stimuli virtually everywhere in the world. It’s driving up demand for virtually everything, and we’re seeing that effect in the steel sector and in commodities sectors.
Fitch now forecasts US GDP growth at 6.2% in 2021, China at 8.4% (from 8%) and the eurozone at 4.7%. On top of the expected strong economic recovery, the U.S. White House is getting ready to push through USD2 trillion massive infrastructure bill. If it comes true, this will create additional demand for construction materials to be transported via bulkers. Back in 2009, China dished out RMB4 trillion (USD560 bn) infrastructure stimulus which led to a commodity boom post-GFC that pushed BDI-Panamax Index towards 4000 level. The index didn’t sustain at the elevated level for too long mainly due to a lot of new ship were delivered from the record order book back then.
On supply side, the net fleet growth is limited. If BDI sustains at current level for another few quarters then some ship owners may decide to buy new ships. However, in that case those new vessels will only be delivered in 2023 and beyond. Many shipyards are getting busy with strong container ships order and it certainly prefer to focus on building these higher margin container ship than lower margin dry bulkers.
Container Ship Orderbook as a % of Existing Fleet Has Dropped Significantly
 Source: Alphaliner
Containers ships orderbook-to-fleet ratio dropped to multi-decade low of 8% of existing fleet in 2020 and rebounded to 14.7% in Mar’21. The container TCE rate has been staying at elevated level since Jun’20 and it eventually led container liners to place order for new ships. While the orderbook level appears to be high, the delivery will spread out over 3 years from now as the shipyard capacity has been filled up. In addition, a large percentage of the new build would be used to replace older ships that will be scrapped over the next couple of years. All in all, net fleet growth is expected to be slower than demand growth for 2021 and 2022.
Malaysian Bulk Carriers (Maybulk)
Maybulk operates 12 dry bulk carriers comprise 7 larger vessels (Supramax and Kamsarmax) and 5 smaller vessels (Handysize). It currently owns 7 of the vessels while the remaining 5 (mainly smaller vessels) are secured via long term charter. (The number of vessels is updated based on the recently released annual report.)
 Source: Company
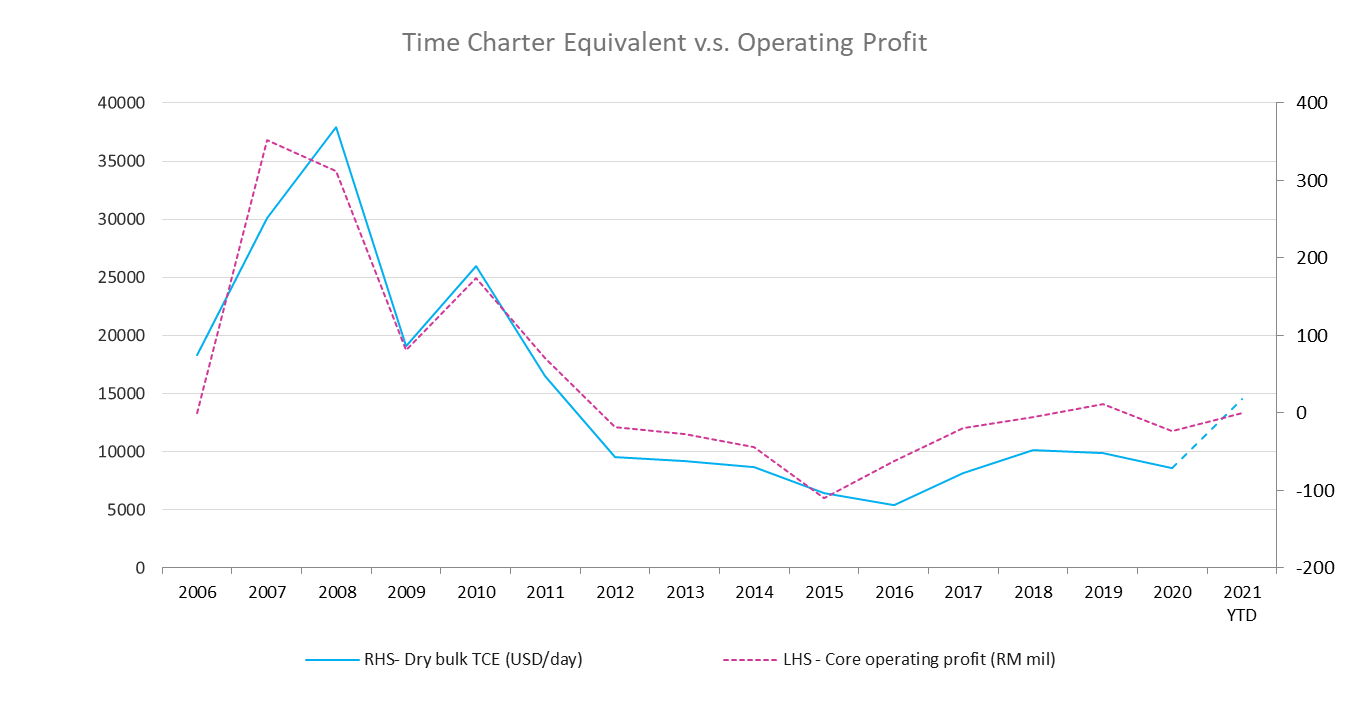
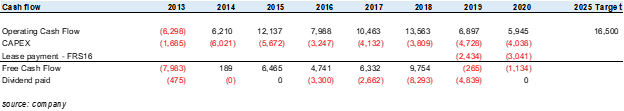
The operating performance of Maybulk essentially follows the BDI cycle. Core operating profit hit a peak of RM350m in 2008 and dropped to a low of negative RM110m in 2015. For year 2020, the realized time charter equivalent (TCE) was USD8,566 and core operating loss was RM23m. Currently, the spot TCE is around USD20,000 while the year-to-date average is around USD15,000 as the spot rate only started to surge in middle of February.
TCE is calculated by taking voyage revenues, subtracting direct voyage expense, including canal, bunker and port costs. The remaining cost items for a shipping company (maintenance, depreciation and salary) is predominant fixed and hence every increment dollar in TCE flows directly down to net income. (Shipping company doesn’t have to pay tax, legally.)
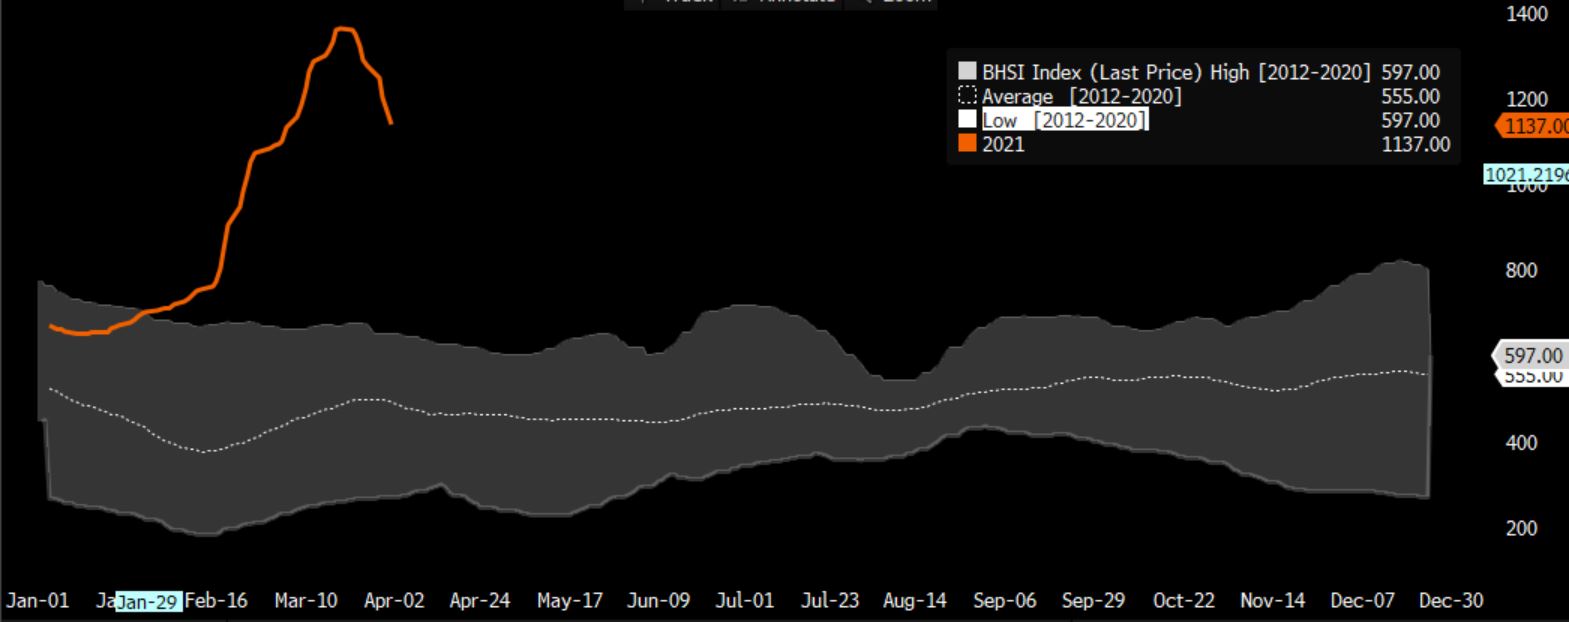
Seasonality of Baltic Dry Index
 Source: Bloomberg
The seasonality chart since 2012 shows that TCE for bulkers typically hit a low in February (Chinese new year) and is higher in second half of the year (harvest seasons in northern hemispheres). For this year, the spot BDI Handysize Index (orange line) surges to decade high in a seasonally weaker half of the year. This bodes well for the TCE rate when it enters seasonally stronger second half.
Replacement Cost
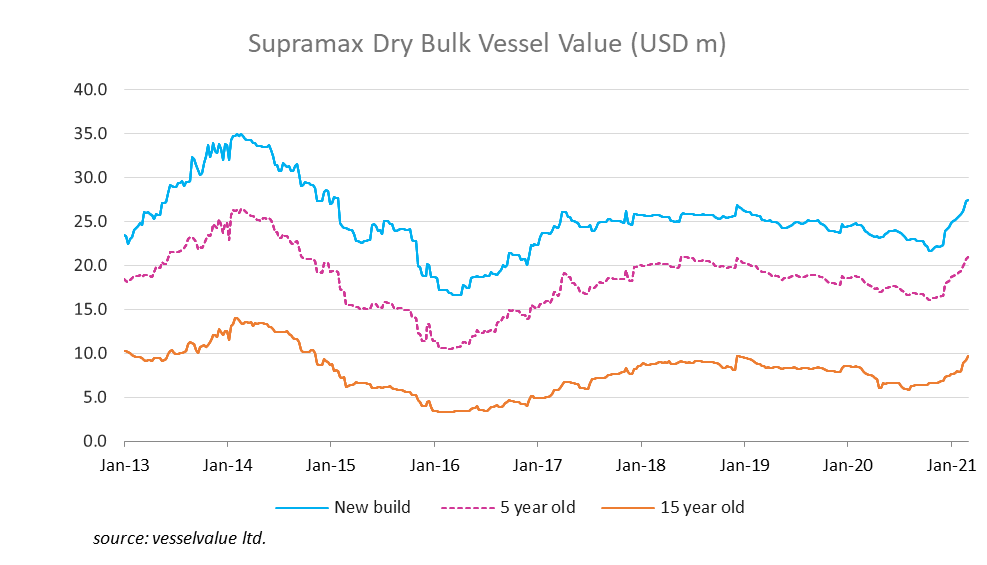
Maybulk booked an impairment loss of RM56m last year due to weak TCE and low vessel value. The average age of its fleet is 7 years old and the second-hand vessels value has moved up by more than 30% since year end. It means the replacement cost of its vessels (inclusive of long-term charter) is almost RM150m above what was recorded. This will raise its adjusted NAV to about RM420m.
Capital Management
As a minority shareholder, we rely on management to run the business well to generate cash flow. Equally important is the integrity and capability of the management in allocating the capital earned from business. We are counting on them to channel these cash flow either back to us or to further reinvest in the business if it makes economic sense.
By analyzing the long-term capital allocation of Maybulk we can understand why Kuok’s group of companies has a good reputation in the market. In the last 17 years since listing, the company generated total operating cash flow of RM2,317m. It has also generated a RM427m from via disposal of vessels and that made the total free-cash-flow (FCF) to reach RM2,745m. 60% of the FCF worth RM1,639m were paid out as dividend and RM435m was used to reduce borrowing. The management made a mistake by investing into PACC offshore in 2008 (with follow-up investment) and it costed them around RM740m. To be fair, PACC was doing well prior to the oil crash in 2014 which wasn’t possible to foresee back in 2008.
The management has shown self-restraint in buying expensive new ship during the boom time prior to GFC and in fact sold its older ships at substantial profit. A portion of the proceeds were then used to buy newer ship post-GFC as vessel price dropped to maintain its competitiveness. (Current fleet average age: 7 years old)
Summary
As we have laid out in the industry overview, the incremental supply is limited and the demand is likely to be greater than supply in the coming 2 years. Chances are the average TCE rate for 2021 and 2022 will be substantially higher than what we saw it 2020.
In general, the time gap between booking and voyage is 3 months and hence the high TCE rate that we see now will only be recognized in 2Q2021 result. Based on our estimation, every USD1,000 increase in TCE may improve Maybulk’s bottom line by around RM11m (Refer to addendum below). For full year 2021, we are currently expecting the TCE to average between USD15k to USD18k, thereby generating a net income between RM55m to RM88m. If we are right on the supply and demand dynamic (and if US infrastructure stimulus comes in), year 2022 could be an even better year. The current market cap of Maybulk at the point of writing is RM520m, it is potentially trading at a forwards P/E of less than 7x.
The share prices of other dry bulk shipping companies such as Pacific Basin, Star Bulk, Thoresen Thai, Genco Shipping and Eagle Bulk have gone up by between 50% and 150% year-to-date. Meanwhile, share price of Maybulk has barely moved, we believe it is due to the large disposal by its substantial shareholder Bank Pembangunan. We take it as an opportunity and we believe that in the long run, the industry supply and demand dynamic, profitability and dividend payout and yield will prevail.
Addendum
Following the publication of 2020 annual report, the earnings improvement for every USD1,000 increase in TCE is now lowered to RM11m from RM15m to reflect a smaller fleet size of 8 vessels (including 1 committed to be sold).
Notes and Disclaimers
This essay and the information contained herein is not a specific offer of products or services. Information on this essay is not an offer to buy or sell, or a solicitation of any offer to buy or sell the securities mentioned herein.
Oaklands Path may be long or short the securities mentioned herein and has no duty or obligation to disclose or update our action on these securities.
This essay contains information and views as of the date indicated and such information and views are subject to change without notice. We have no duty or obligation to update the information contained herein. Further, we make no representation, and it should not be assumed, that past investment performance is an indication of future results. Moreover, wherever there is the potential for profit there is also the possibility of loss.
Certain information contained herein concerning economic trends and performance is based on or derived from information provided by independent third-party sources. Although we obtain information contained in our newsletter from sources we believe to be reliable, we cannot guarantee its accuracy. Moreover, independent third-party sources cited in these materials are not making any representations or warranties regarding any information attributed to them and shall have no liability in connection with the use of such information in these materials.