The shipbuilding industry and the best-managed shipbuilder in the world - Yangzijiang Shipbuilding
11 May 2021
(Please refer to the previous write-up on the shipping industry for important background information.)
Brief History of the Shipbuilding Industry
The shipbuilding industry plays an important role in both commercial and military sectors. Historically, strong naval capability is a prerequisite for a country to become global power. Many state-owned shipyards are born to build military vessels and moves on to build commercial vessels subsequently. Hence, a private shipyard not only has to compete with other private companies that operates within market economics, it also must compete against many state-owned yards which could be run inefficiently but has access to limitless government coffer. It is a highly competitive industry.
 Source: International Journal of East Asian Studies Vol. 6, No. 1, 2017, pp.65-81
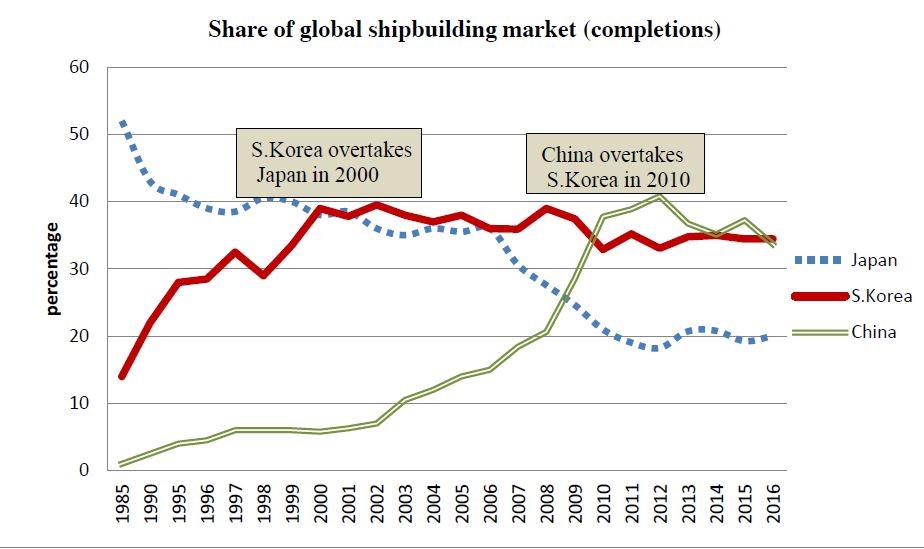
United Kingdom was the largest shipbuilding nation prior to world war II. It lost competitive edge to post-war Japanese government led shipbuilding boom. Japan overtook UK in 1956 as the number one shipbuilding nation in 1956. Its share of world ship completions (by gross tonnage) rose from 22% in 1960 to a majority 53% share of world completions by 1984. Following the signature of The Plaza Accord in 1985, Japanese yen appreciated by 50% against the US dollar and it sharply increased the labour cost in Japan. By mid-1990s, the shipbuilding cost in Japan was 25% higher than that of South Korea.
South Korea started with 1% of world ship completion in 1975 and overtook Japan as the world number one shipbuilding nation in 2000, marking an end to Japan’s long reign of 44 years. By learning from the Japanese and South Korean, China joined the race with large state-supported shipbuilding programs. China market share by completions rose from 6% in 2000 and overtook South Korea in 2010 as the number one player.
 Source: The shipbuilders' association of japan
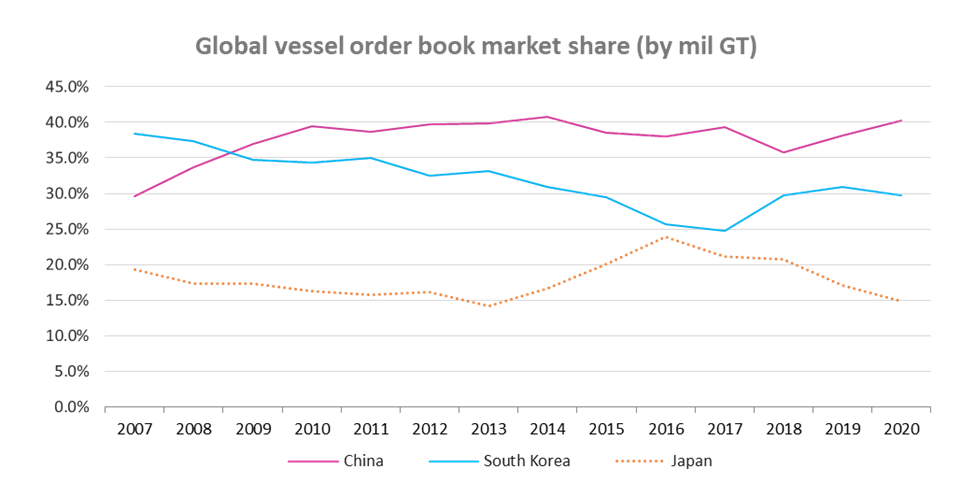
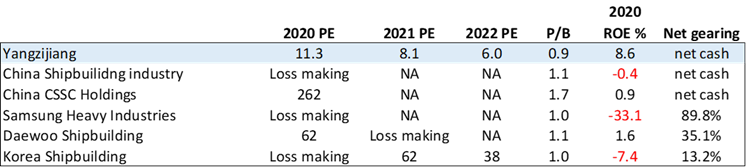
Based on vessel order book at end 2020: China ranked number one with 40% market share; South Korea ranked second with 30% share and Japan ranked third with 15% share. The leading South Korean shipbuilders (Hyundai Heavy Ind, Samsung Heavy Ind, and Daewoo Shipbuilding) continues to rank among top 5 shipbuilders in the world. Facing intense competition from the Chinese shipbuilders, the South Korean shipbuilders have essentially given up on building dry bulkers and choose to focus on high-end offshore vessels (i.e. FPSO, FSO & etc.), LNG/LPG tankers and large container ships. The high exposure to offshore business bankrupted several large South Korean shipbuilders following crude oil collapsed in 2014. In 2017, Daewoo Shipbuilding was bailed out by South Korean State banks with USD2.6bn.
In the last 20 years, Chinese shipbuilders have also improved its competitiveness substantially in the higher value-added ship sector. It has delivered the largest dry bulk carriers in the world (400k DWT by Yangzijiang), second largest semi-sub in the world (98k DWT by COSCOL) and largest container ships currently in-use in the world (24k TEUs to be delivered by a few yards including Yangzijiang). Nevertheless, Chinese shipbuilders only has limited presence in the high end (and lucrative) LNG carriers’ market. Looking at the research and development effort of Chinese Shipbuilders, coupled with strong domestic demand and low operating cost, it is just a matter of time before it breaks into the LNG carrier’s market.
Competitive advantage wise, the cost of manpower in China is less than one-third that of South Korea. China also controls more than 50% of the global steel production capacity. In conjunction with the large masses of educated workforce (9 million graduates per year) being produced, Chinese shipbuilders will continue to lead the world in terms of quantity while producing the finest ships in the coming decades.
Shipbuilding Cycle (by completions)
 Source: Clarkson Research Service, 2017; International Journal of East Asian Studies Vol. 6, No. 1, 2017, pp.65-81
It is the volume and pattern of seaborne trade that generate the demand for cargo-carrying ships. However, the long lead time in building ships and the uncertainty in predicting future trading markets contribute to an imbalance between supply and demand and to boom and bust cycles in shipbuilding, in addition, there is some purely speculative ordering of ships for the purpose of selling them later at a profit.
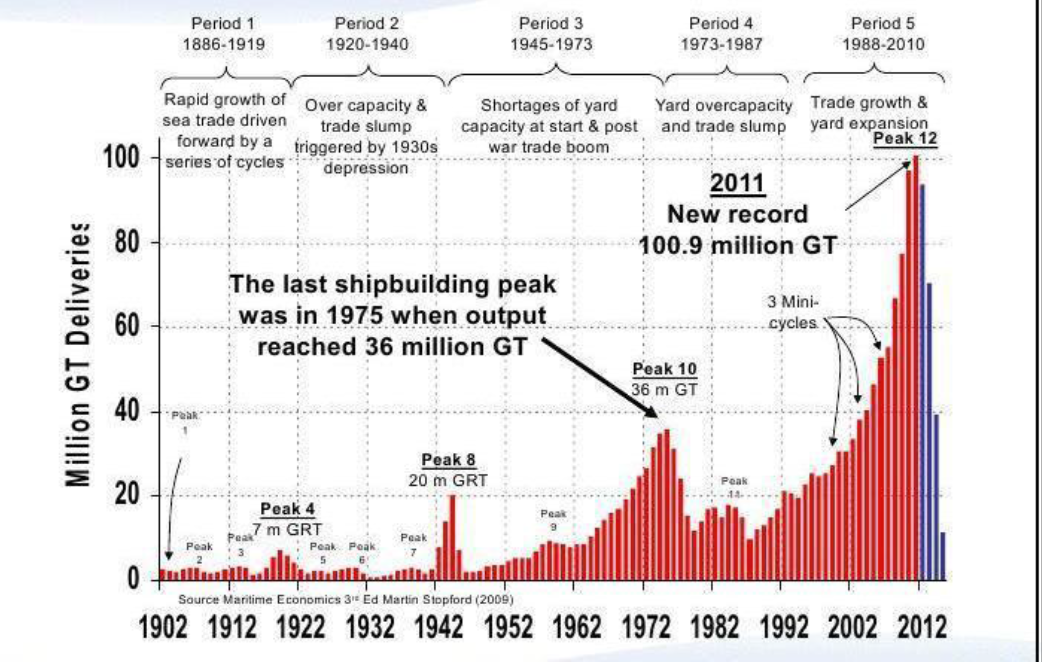
Since 1896, the industry has experienced more than nine major cycles, each with more than 40 percent reduction in demand. When a major upcycle arrives, the boom could last several decades and following bust could last more than a decade. The number of shipbuilders would shrink by more than 90% during a major down cycle and led to industry consolidation as some companies grows stronger.
The latest boom peaked in 2011 based on deliveries and the industry has experienced massive downsizing and consolidation for a decade. Some of the major South Korea shipbuilders have gone bankrupt and the number of shipbuilders in China has reduced from more than 3000 in 2008 to less than 300 by 2014. By 2015, the prolonged industry down cycle has come to a stage where there is hardly any profitable shipyard regardless of size or location around the world. As of now, the top 10 largest shipbuilders in China controls more than 90% of the country’s vessel order book.
Looking at the current orderbook as a % of existing fleet for both bulkers and container ships, it appears that we are at the beginning of an upcycle. However, the duration of this upcycle is correlated to incremental demand & supply as well as port congestion and covid-19 restriction. Hence, it is difficult to know if this cycle would last 2 years or 10 years, but it is possible to follow these developments closely to have some view over time.
International Maritime Organization (IMO) rules and regulations on vessel emission standards is another major factor supporting the long-term demand for containerships and dry bulkers. To achieve the 2030 emission standard set by IMO, the global fleet needs to be renewed using new type of fuel while excess shipping capacity being absorbed.
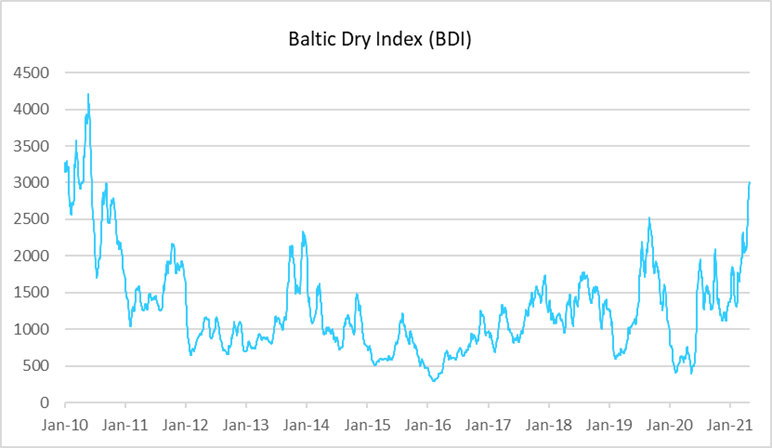
Baltic Dry Index (BDI) at Decade-High
 source: Bloomberg
Container Freight Rate Sustained Decade High Level
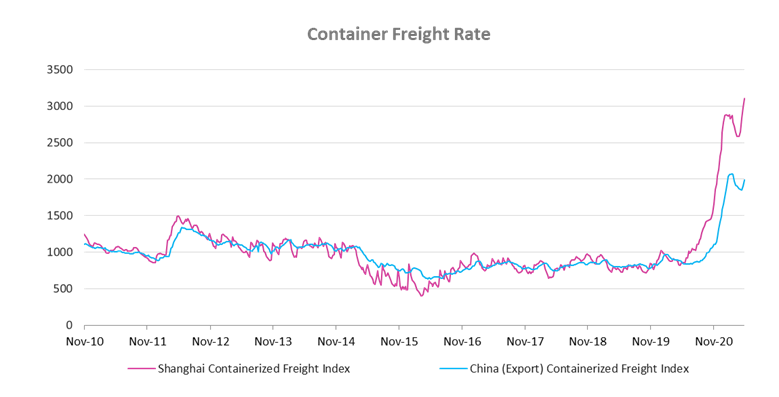 source: Shanghai shipping exchange
Container Ship Orderbook as a % of Existing Fleet Has Dropped Significantly
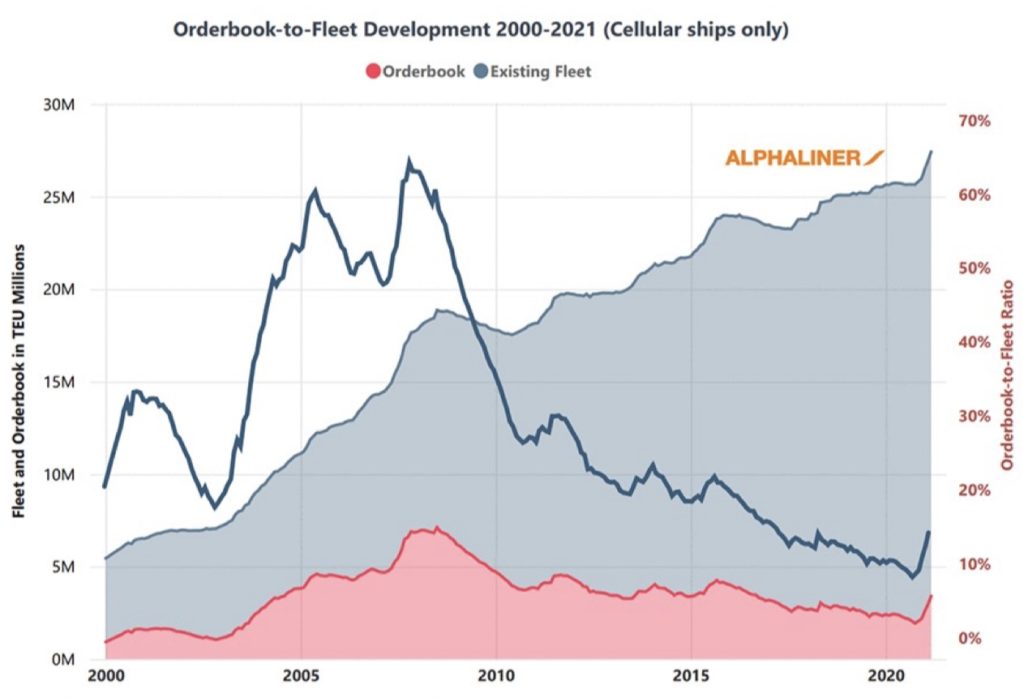 source: Alphaliner
Container ships orderbook-to-fleet ratio dropped from a high of 65% to multi-decade low of 8% of existing fleet in 2020 and rebounded to 16% in Apr’21.
Bulker’s Orderbook as a % of Existing Fleet Has Dropped Significantly
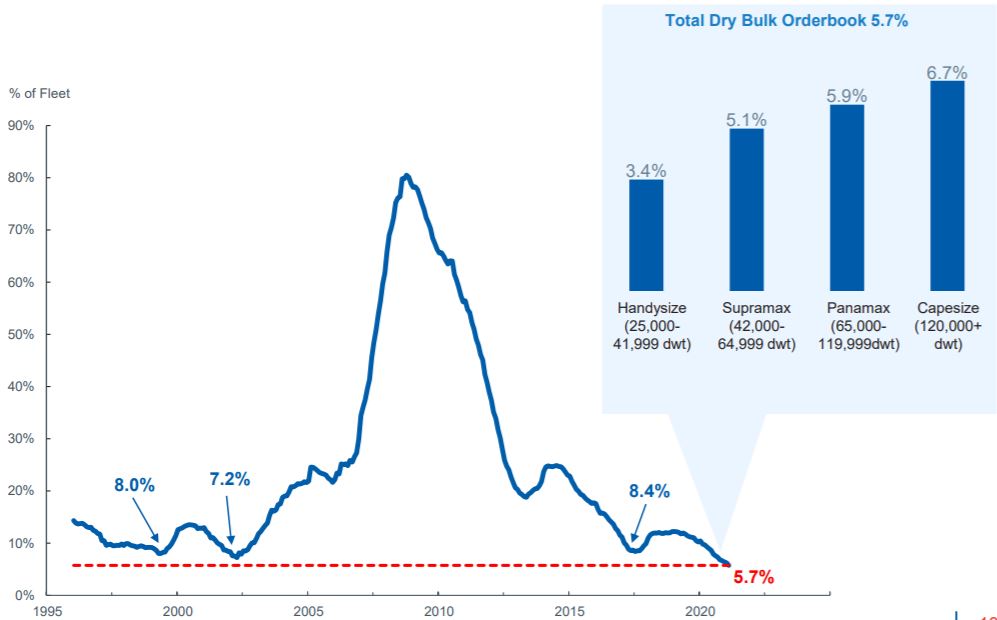 source: Pacific Basin
Bulkers’ orderbook-to-fleet ratio stood at multi-decade low of 5.6% of existing fleet as Mar’21 and is set to go lower due to the price differential between new builds and second-hand ships and uncertainty around environmental regulation. However, if the Baltic Dry Index (BDI) sustains at current level for another two quarters then some ship owners may decide to buy new ships by year end.
Best managed shipbuilder in the world - Yangzijiang Shipbuilding
We have shown that China is number one shipbuilding nation (by quantity) and is likely to maintain its lead in the coming decades while moving up the value chain to build the finest ship in the world. Yangzijiang is by far the best shipbuilder in China in terms of quality, speed of delivery (productivity), innovations and profitability. It puts them as the best managed shipbuilder in the world. We are careful with the term we used here - we are not calling it the “best shipbuilder” in the world because it is yet to penetrates the highest end LNG vessels market which are mainly served by South Korean companies. Nevertheless, we believe it is just a matter of time before it wins over that market.
A brief history and the integrity of the management
In 1998/99, Yangzijiang was facing severe financial difficulties due to near zero new orders because of the Asian Financial Crisis. The company was recapitalized and privatized (i.e. management buyout from government) under the leadership of current honorary Chairman Ren Yuanlin. Majority of the employees became shareholders and participated in the fate of the company. Currently, more than 70% of the employees are shareholders via various trust structures that ensure long term ownership.
Starting from day one, the interest of the owners and managers are aligned. In a media interview, Mr. Ren mentioned the management often received thousands of suggestions from employees each year to improve the productivity of the company. Essentially, everyone is working for themselves.
The integrity of the management can be seen through the track record of the business, capital allocation, their attitude towards minority shareholder as well as how they treat themselves versus other shareholders. The total remuneration of the Honorary Chairman was merely SGD65k and for the CEO it was SGD78k last year. For a company that regularly earns more than SGD500m a year, we could not think of many other companies that has such a low remuneration to profit ratio. Much of their income comes from the roughly SGD50m dividend they collected each year. (According to Sina, they have been donating a large amount of it to charity organizations.)
The company has been paying annual dividend since listing in 2007 with a payout ratio of roughly 30% and it has been buying back shares in the last three years. We can also feel they do pay attention and is sincere towards minority shareholders through analyst briefings and AGM.
On 12 April 2019, Mr. Ren Yuanlin donates 150 million Yangzijiang shares (3.8% of total shares outstanding) to senior management incentive scheme under a trust, thereby reducing his effective shareholding to 21.61% after the donation.
To quote Mr. Ren:
“Yangzijiang’s achievements over the past few decades wouldn’t have been possible without our loyal, professional and dedicated management team. It’s my strong belief to incentivize the team through sharing the rewards.”
We often see company giving out ESOS or share awards to incentivize and retain senior management, diluting all shareholders at the same time. We cannot think of many other examples of such generosity exhibited by the top leader. Perhaps it takes a lot of good fortune to able work under such leader.
To further quote Mr. Ren:
“当你只有一碗水时,可以一个人喝;当你有一桶水时,可以和一群人喝;当你有一河水时,应和一批人喝。钱来之于社会,应该让它回馈社会,这是企业家的一种社会责任。”
Capability and progressiveness of the management
The number of shipbuilders in China has reduced by 80-90% from more than 3000 in 2008. As a private shipbuilder that has no access to both government’s orders (i.e. Naval vessels) and government’s coffers, it can only survive by continuously improving productivity while maintaining a strong balance sheet. Currently, the top 10 largest shipbuilders in China represents more than 90% of the country’s vessel order book.
Yangzijiang’s capacity is just fraction of its state-owned peer but it has consistently been the most profitable shipbuilder in China in the last decade. In some of the years its profitability represented one-fourth to one-half of total industry profit.
The company has been moving up the value chain via continuous R&D investment as well as striking partnerships/ JV with others. Some of the major progresses are:
2013 - launched China’s first ever 10,000TEU containership. It achieved a breakthrough in an area that was traditionally dominated by South Korean shipbuilders.
2016 - delivered its first 260,000 DWT very-large ore carrier.
2017 - delivered its first Liquefied Natural Gas (“LNG”) vessels.
2018 - delivered the first batch of 400,000 DWT Very Large Ore Carrier, largest dry bulk carriers ever constructed in the world.
2020 - secured order for 24,000 TEU containership, largest containership currently in use in the world.
Order Book, New Order, and Containership as a % of Order Book (by no. of vessels)
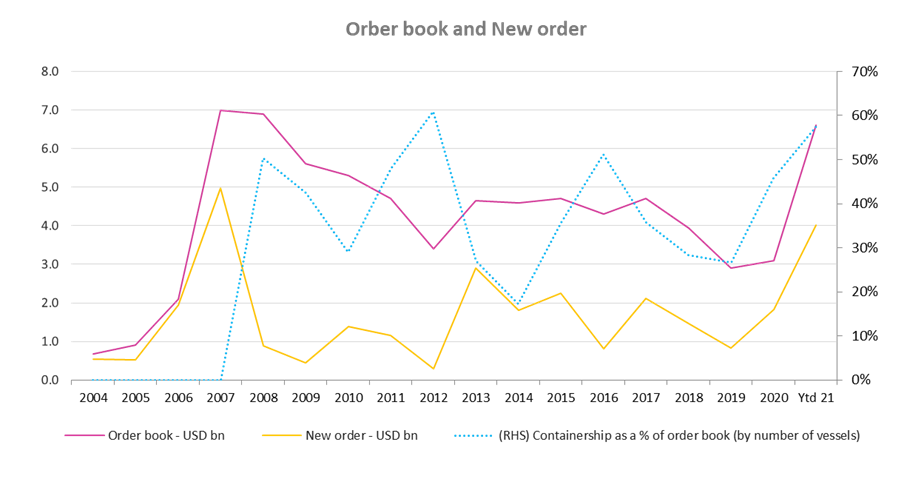 source: company
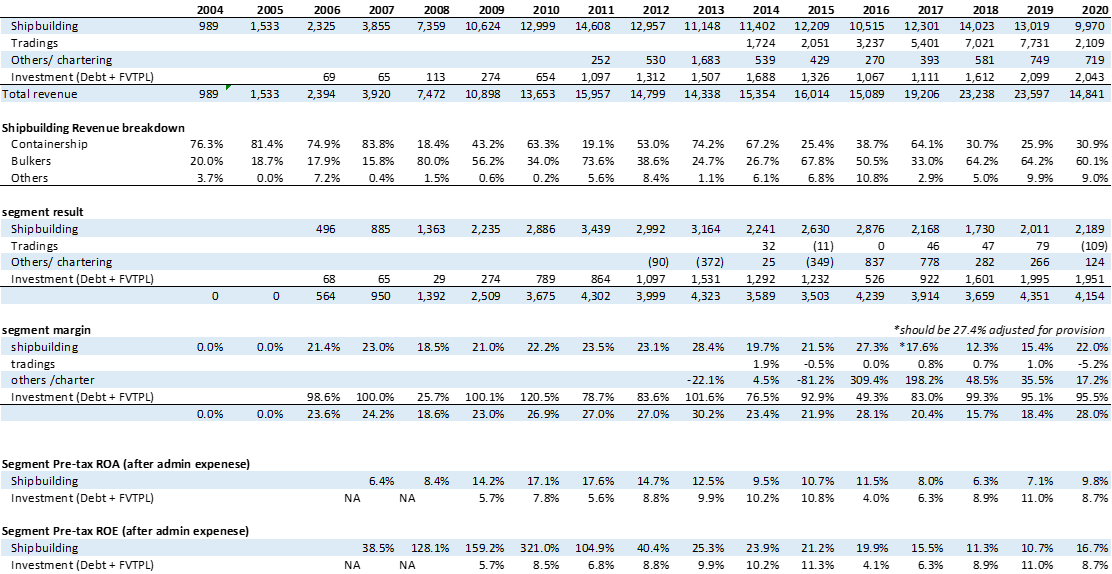
The current order book of USD6.6bn is the highest since 2008. Total new order received in the first 4 months of 2021 totaled USD4bn is the highest since 2007. Containership order represents 58% of total number of vessels ordered. Value wise, given that most of the new order received is for larger containership which carries way higher value per vessel, it is likely that the containership value in dollar term is more than three-quarter of total order book. (Containership usually carries 5% to 7% higher gross margin as compared to bulkers.)
Given the sustained high container shipping rate and various options purchase yet to be exercised, we believe more order for containership may come in in the near term. As mentioned, if the BDI sustains at current level for another quarter or two, we are likely to see bulkers order to finally come in by year-end. Overall, there is a reasonable chance that the company may break both new order and order book record this year.
Order Book Ranking
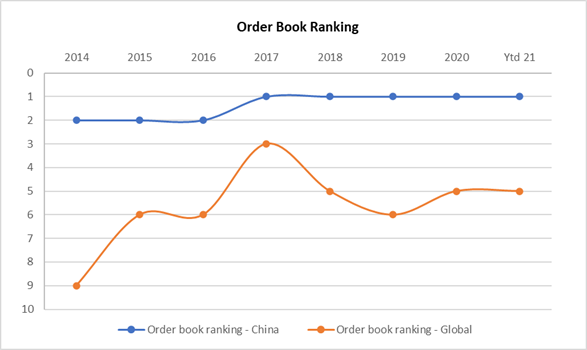 Source: Clarkson; Sofreight
Yangzijiang’s order book has consistently ranked number one in China since 2017. Globally, its order book ranking has moved up from ninth place in 2014 to fifth place now. Its global market share has also gone up from 2% back in 2007 to about 7%.
Competitive Advantage
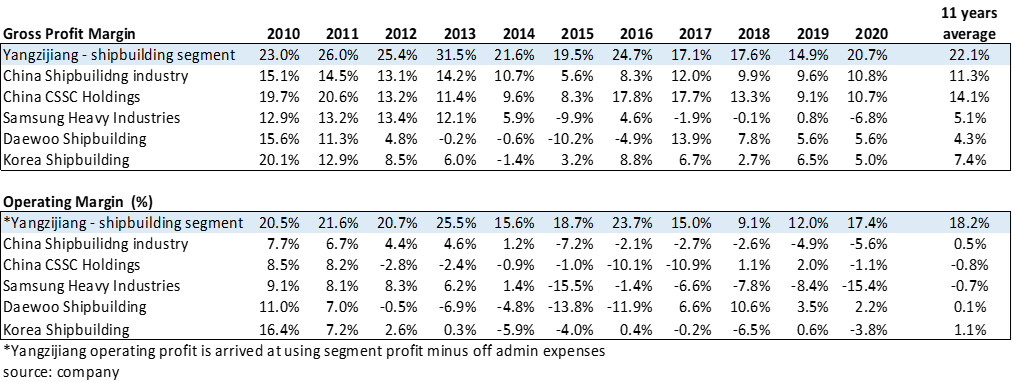
Historical margins of the Top 6 largest shipbuilders in the world
 source: Bloomberg
In the past 11 years, the gross profit margin of Yangzijiang shipbuilding segment averaged 22%. This is roughly 15% to 17% higher than the three largest South Korean Shipbuilders and around 8% to 10% higher than the largest Chinese state-owned shipbuilder.
The operating margin of Yangzijiang shipbuilding segment averaged 18.2% in the past 11 years, which is 17% to 18% higher than its peer. It is truly a hell lot of difference. It has been consistently profitable and generating strong cash flow while major competitors are hemorrhaging and seeking bail-out.
The question is what led to such a shocking difference in terms of profitability? We believe a combination of the following factors form the main competitive edge of the company:
Owner-oriented mindset from top to bottom.
Cost leader – it has lower labour cost than South Korea shipbuilders and higher productivity than China state-owned shipbuilders. It also does not outsource production processes like the South Korea companies. Together with slightly lower material cost in China, in aggregate it provides a 5% to 10% of durable cost advantage.
Flexibility and practical: it has exhibited great flexibility in terms of shutting down Changbo yard and consolidated orders to its two main yards. Over the years it has attempted several ventures (ship demolition, property, microfinance and, steel and equipment sourcing) to enhance the company during shipping downturn but are quick to shut it down/downsize when it realized it is not a good business.
Centralized location – all its shipyards are along the Yangtze river and near each other. This allows for maximum flexibility in manpower, planning and lower logistics cost. This is completely different situation for its two largest state-owned competitors (i.e. CSSC and CISC).
Prudent accounting – the company has always been fast when comes to making provision for warranty and bad debt. Most of these provisions were reversed in the later years. It may be not sound like an edge but prudent accounting speaks a lot of the corporate culture.
Capital strength – Given that many of its peer has the implicit backing of state, this business must operate from a strong balance sheet position. It allows the company to obtain favourable prices in procurement, lowering production cost. In addition, it enables the company to build extra vessels for chartering during downturn to achieve economic of scale in production, lowering the unit cost. Eventually when the good time arrives, these vessels can be disposed at a decent profit. (Nevertheless, the company is indeed holding way too much cash.)
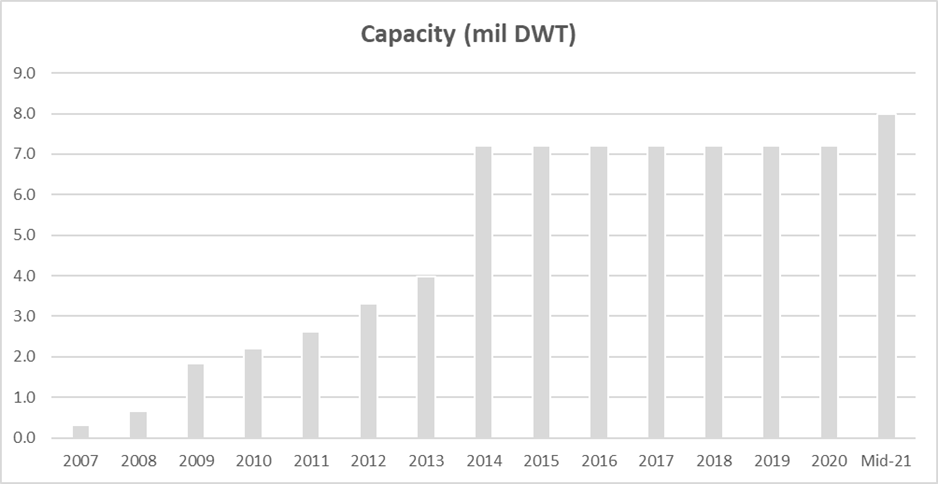
Shipbuilding Capacity in million dead weight tons (DWT)
 source: annual reports
Yangzijiang current shipbuilding capacity stands at 7.2m DWT (Xinfu yard– 3m; New Yangzi yar – 3m; Yangzi-Mitsui - 1.2m). It will restart the operations of the Changbo yard by mid-2021 and it shall add another 0.8m DWT or so (Changbo is for smaller vessels).
The measurement of capacity in DWT term is not the ideal way to think about the potential output in dollar terms. For example, containership is way more complex and technical than a bulker and may take longer to build but command much better pricing and margin. Unfortunately, we do not have the data in compensated gross ton (CGT) term but we still can make some educated guess.
One 8000 TEU containership is about 100k DWT, if all Yangzijiang capacity is used to build this type of ship (which is unlikely to happen in reality) then it could build up to 60-65 ships a year (large container ship takes more than a year to build). Assuming average price of USD80m per ship then the maximum dollar output could reach USD5bn. The actual maximum dollar output is likely to be lower than this but bear in mind that the management has also said productivity has gone up by about 25% in the past five years.
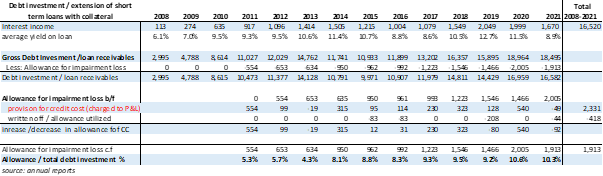
Debt Investment Segment (Treasury Management)
Yangzijiang has been deploying excess cash into secured debt investment since 2008. Essentially, it is giving out short term loan to medium size corporates in China backed by collaterals. It is professionally managed by a team of 40 ex-bankers and lawyers. Actually, this type of business is quite common in China because it is not easy for private businesses to borrow from state-owned banks quickly. In Singapore, there is another listed company called First Sponsor Group (FSG) Limited (controlled by Hong Leong Group) also engaged in similar business for over a decade. Most of FSG loan book is back by land and property in China and has also been performing well.
However, the presence of this business segment may spook off some investors due to lack of understanding since it is very uncommon in this part of the world. Objectively, let us take look at the track record of this business:
 source: annual reports
The average yield on loans is around 10% to 11%. The default rate is less than 5% and the recovery ratio is more than 70%. This means a net credit cost of less than 1.5% per annum. (Given that it is an important division, we do hope the company can also disclose bad debt write off and recovery ratio in the quarterly and annual results.)
Since 2008, the business has generated RMB15.3bn of interest income with a total provision of RMB2.2bn. We estimate the cumulative after-tax net income to be RMB9.8bn over the same period. The long-term average ROA/ROE is between 7% to 8% per annum. The business is fully self-funded, all the RMB14.9bn outstanding as at 1q2021 are the company’s own cash. It is rare for us to see a lending business with zero gearing and most finance companies generate double digits ROE due to leverage. However, we believe that when you only lend out your own money, you tend to be more careful.
It is important to note that out of the RMB14.9bn outstanding amount, RMB9.8bn comes from the cumulated profits that the investment business has generated since 2008.
The purpose of engaging in debt investment is to provide some stability to the group when shipping market goes down. Another important point is that the repayment/redemption in 1Q2021 alone is RMB8.1bn, it shows the loan book has a short duration (and safer generally) and mostly are for bridging finance purpose. The allowance as a percentage of total loan outstanding stands at 11.1% as at 1Q21.
 source: company presentation slides
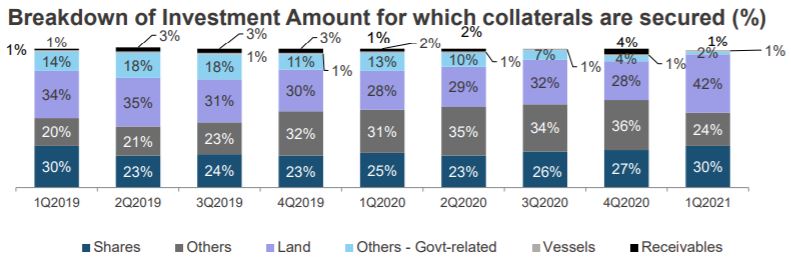
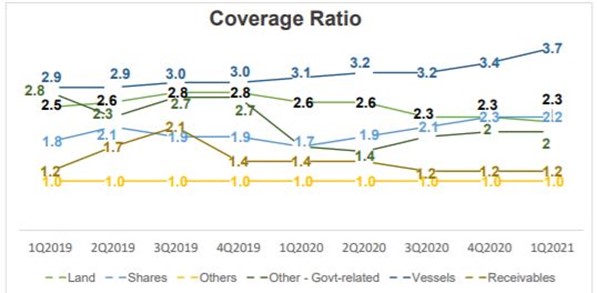
The loan book is fully secured against shares, land, local government’s guarantee etc. The loan-to-value ratio (inverse of coverage ratio) usually runs between 30% (for shares collateral) to 50% (for land-based collateral). For local government guarantee type of collateral, the LTV is 100% as the risk of losing money is very minimal. The track record since 2008 in terms of provisioning, recovery ratio and net credit cost has demonstrated that its lending practice has in fact been highly secured.
More importantly, in the recent analyst briefings, both the CEO and CFO have guided that they have put a cap on this business, considering feedback from investors as well as to enhance corporate governance.
Other than carrying out debt investment activity, the company has also deployed RMB2.65bn into financial asset at fair value through profit and loss (FVTPL). Essentially, this represents investment into some venture cap funds and there has been several disposal/cash out as reported in the past annual reports. Overall, its FVTPL investment has also performed well over the years.
Profitability
 source: annual reports
Both the shipbuilding and investment division have done well through the cycles. The chartering division now has 24 vessels (22 bulkers) carries at net book value of RMB2bn. These vessels were built during downturn to enable the shipyards to operate at optimum utilization and chartered out on short term basis for income. With the decade high BDI, the profit contribution from this division is likely to go up a few times. However, the second-hand vessels price is also surging (see Appendix 2) and the management has made it clear that these vessels will be disposed off when the time comes. We believe the disposal is likely to result in meaningful gain to the company.
The ROE of the shipbuilding division is way higher than the investment division and since the order book is at decade high now, more resource will be channeled to the shipbuilding side. It is really a positive news that the management has decided to cap the size of investment division since the ROE is lower and hence dragged down the group ROE.
Capital Allocation
 source: annual reports, Bloomberg
As a minority shareholder, we rely on management to run the business well to generate cash flow. Equally important is the integrity and capability of the management in allocating the capital earned from business. We are counting on them to channel these cash flow either back to us or to further reinvest in the business if it makes economic sense and improve ROE.
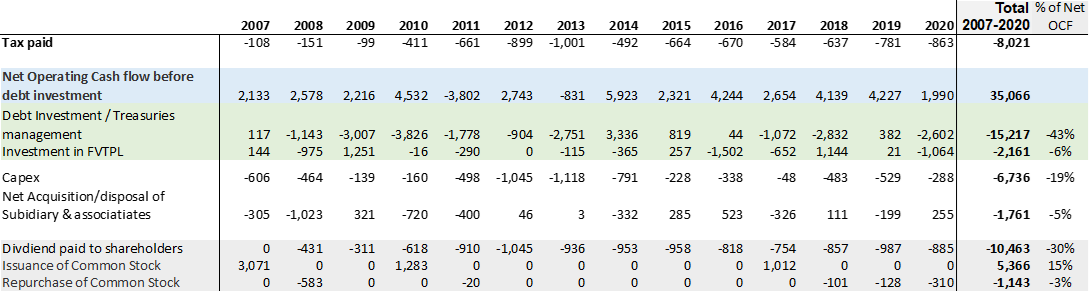
Yangzijiang has generated total operating cash flow before debt investment (OCF) of RMB 35bn since listing. It has allocated 43% of OCF into debt investment and another 6% into FVTPL. Total capex and acquisition for business expansion represented 24% of OCF over the same period.
It has returned RMB 11.5bn (33% of OCF) back to shareholders via dividend and buybacks and raised RMB 5.4bn equity in the early years for expansion. The remaining OCF went into its net cash balance of RMB 2.4bn as at end-2020 (1Q21: RMB 8.8bn).
In the last 14 years, Yangzijiang has also paid RMB 8bn worth of taxes to the Chinese government. The total tax paid together with net payback to shareholder (Dividend + buyback – equity issuance) amounts to RMB 14.2bn since 2007. This should allay any concern such as “the cash may not be there because it is a S-chips”.
Moving Up The Value Chain – LNG Vessels and Dual-Fuel Ships
In June 2018, Mitsui E&S (MES) decided to cease shipyard business for commercial vessels, a perennial money loser due to intense competition with Chinese and South Korean rivals. In Oct 2018, Yangzijiang formed a 51:49 joint venture with MES to establish a new shipbuilding company called Yangzi-Mitsui Shipbuilding Co., Ltd. (YAMIC). YAMIC began operation in August 2019 and achieved cash flow positive in the first year. This is probably unheard of in Japan.
YAMIC will expand its capability into more complex and technically challenging vessels, including oil tankers and LNG carriers. Mitsui E&S has a track record in constructing both vessels with a strong sales network, and it is also Japan’s leading manufacturer of marine diesel engines.
Yangzijiang plans to capitalize on the growth of LNG market and expand its market share for mid-sized LNG vessels, especially amongst Chinese shipowners before further expanding its customer base. The gross margin of building LNG vessel is substantially high than its existing types of ships at around 40%.
The IMO regulations on vessel emission are pushing more owners to opt for dual-fuel (fuel oil and LNG) or LNG driven vessels. Many of the old ships will also have to be replaced or upgraded if the coming 2030 emission standard is strictly enforced. These developments would also lead to higher volume and profitability for Yangzijiang.
Summary
In the near term, the near record high order book filled with high margin containership bode well for the coming 2 to 3 years. The current high level BDI with historically low fleet-to-order ratio of bulkers also bodes well for additional orders by year-end. Based on we our calculations, Yangzijiang may earn around RMB3.5bn (SGD0.72bn) in current year and RMB4.7bn (SGD0.97bn) in 2022. Based on the current market cap of SGD5.8bn, it is trading at current year PE of 8x and next year PE of 6x.
 Source: Bloomberg
All its major peer barely made money and consensus seems to assume that trend will continue hence forward PE ratio is not applicable.
As at 1Q21, it has a net cash of RMB 8.8bn, together with its short-term debt investment of RMB 14.9bn (which is 100% funded with own cash as explained above), total net cash amounts to RMB 23.7bn (SGD4.9bn). Hence, cash and short-term debt instrument represents 84% of market cap. Its ex-cash 2021 PE is only 1.3x and for 2022 it is 1x.
With the new CEO and Chairman’s commitment to cap debt investment and improve shareholders’ return (dividend + buyback) over time, Yangzijiang stands a good chance to be rerated upwards with an improved ROE. Ideally, we hope the company would consider spinning off the debt investment division, it serves to unlock the value (RMB14.9bn) trapped inside and enable the investment business to grow further under independently motivated management team. It just does not make much sense to operate a finance business with zero leverage and generate low ROE.
Longer term wise, we believe the company will continue growing and building bigger and higher-end vessel in the coming decade. Given its significant competitive advantage over other shipbuilders, eventually, it may truly become the best shipbuilder in the world.
Appendix
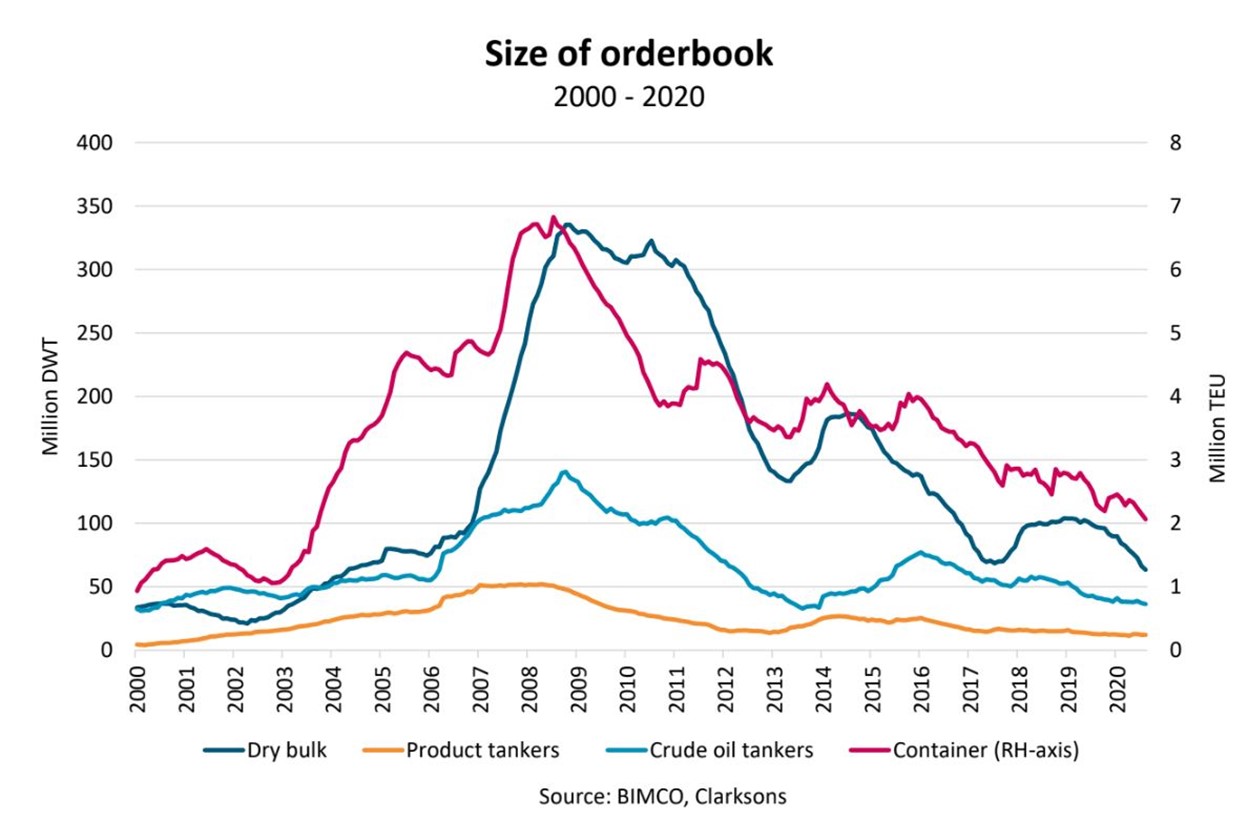
1. Global order book by type of vessels
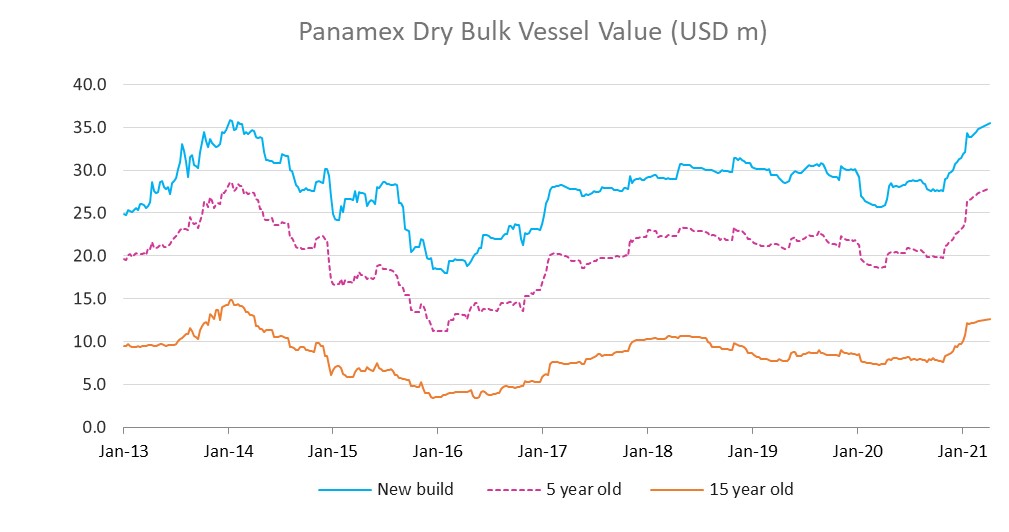
2. Panamex Bullkers Value (USD m)
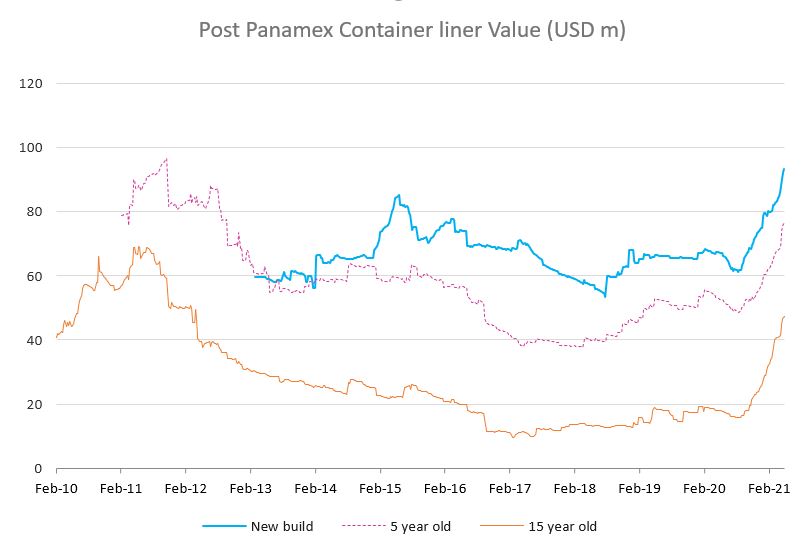
3. Post Panamex Containership Value (USD m)
Notes and Disclaimers
This essay and the information contained herein is not a specific offer of products or services. Information on this essay is not an offer to buy or sell, or a solicitation of any offer to buy or sell the securities mentioned herein.
Oaklands Path may be long or short the securities mentioned herein and has no duty or obligation to disclose or update our action on these securities.
This essay contains information and views as of the date indicated and such information and views are subject to change without notice. We have no duty or obligation to update the information contained herein. Further, we make no representation, and it should not be assumed, that past investment performance is an indication of future results. Moreover, wherever there is the potential for profit there is also the possibility of loss.
Certain information contained herein concerning economic trends and performance is based on or derived from information provided by independent third-party sources. Although we obtain information contained in our newsletter from sources we believe to be reliable, we cannot guarantee its accuracy. Moreover, independent third-party sources cited in these materials are not making any representations or warranties regarding any information attributed to them and shall have no liability in connection with the use of such information in these materials.