Radically Rational Capital Allocation
24 September 2024
For every dollar that a company earns, there are typically four options to deploy the cash:
- Reinvest into the business if it could generate good return,
- Carry out M&A,
- Pare down debt,
- Return to shareholders via share buyback or dividend.
Internally, the management of a public listed company would insist on capital efficiency when speaking to the CEO of its subsidiaries as they understand too much capital brings no good. However, they often fail to apply the same standard to themselves at the holding company level.
To make truly rational capital allocation decisions, managers need to see things from an outsider's perspective. If you were running a listed corporation, the first question you should ask yourself is: what do you expect when you invest your family money in other listed companies?
You probably want them to maximize long-term shareholder value per share. This should be the same standard that we apply to ourselves when running a corporation.
Pecking Order
When evaluating capital allocation opportunities, management typically looks at the risk and return of all internal projects, as well as potential M&A opportunities. For example, an oil and gas producer might compare the IRR of internal projects to the cost of acquiring new oil fields or other oil and gas companies. However, it is very rare for management to compare these opportunities to the return from buying back their own shares.
We created the example above based on a real-world case study of an oil and gas company with international operations. (We will not mention the company's name.) The example shows that if a company has the chance to buy more of an existing producing asset from its partners at an IRR of 22%, then it is the most sensible thing to do, the management should be willing to borrow money to do it.
However, what If the partners in these assets do not want to sell? Shouldn’t the company proceed to buyback its own shares in the public market which also offers 22% IRR? Buying back shares will increase the long-term shareholders interest in existing producing assets. It has no additional execution risk. The return of share buyback can be calculated just like it computes the IRR of all these projects. And if management were willing to borrow money to buy the additional stake from its partners, how about when it was buying back shares? What is the difference? If buying back shares will deliver the highest return at the lowest risk, why not do that aggressively?
If you truly want to maximize shareholder value per share, you should use the potential return from share buybacks as a benchmark for capital allocation. This means that any internal project that cannot beat this benchmark must justify why it should go ahead.
If none of the above options meet the hurdle rate, then the natural course of action is to return capital to shareholders through dividends.
Some examples
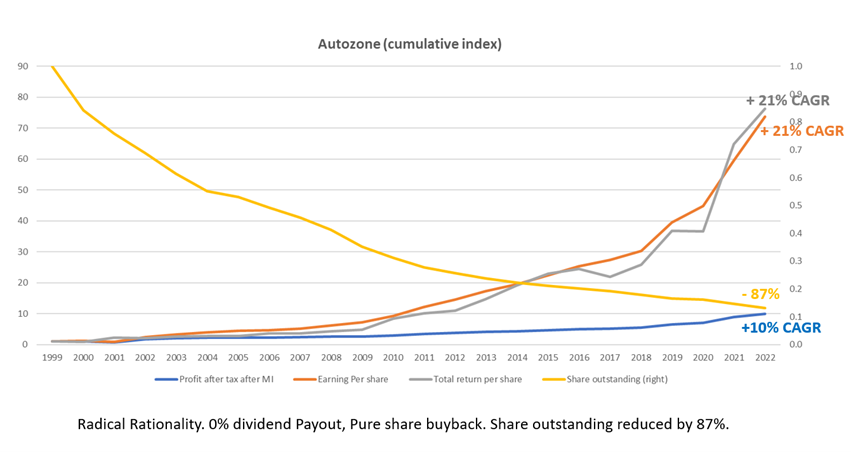
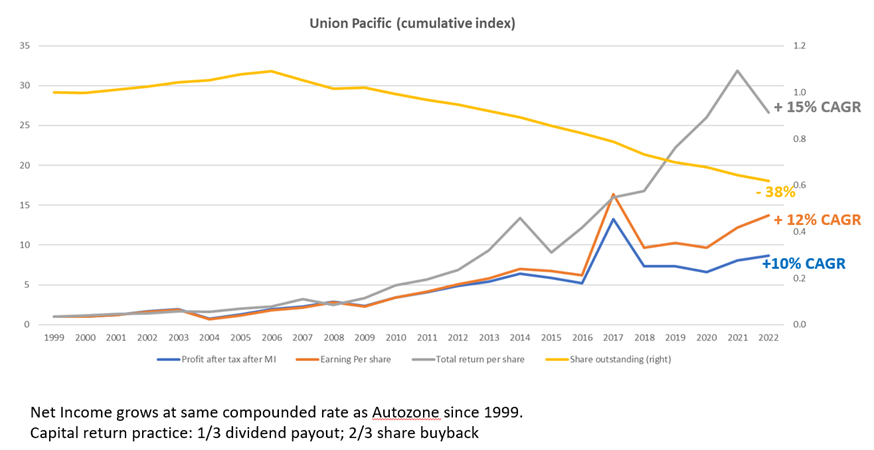
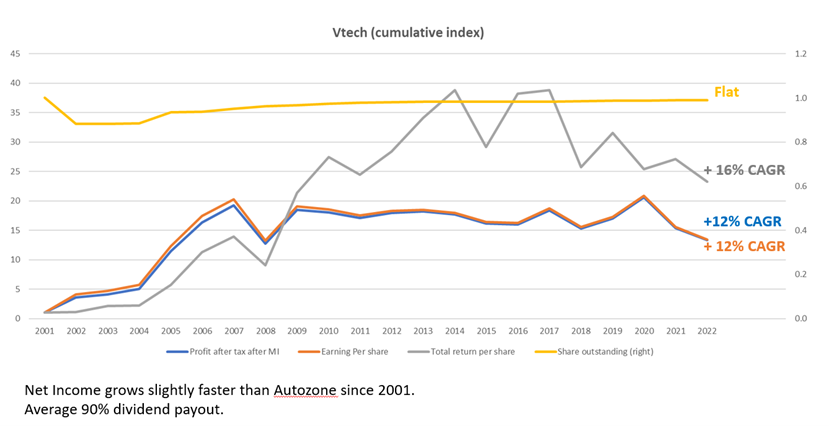
Let's take a step back and look at three companies that have had similar compounded annual growth rates in profit after tax over the past 20 years. The difference between these companies lies in their capital allocation decisions. The first company, Autozone, only does share buybacks and does not pay dividends. The second company, Union Pacific, generally pays out one-third of its profits in dividends and two-thirds through share buybacks. The third company, Vtech, has an average dividend payout ratio of 90% and zero buybacks.
Autozone
AutoZone is the largest retailer of aftermarket automotive parts and accessories in the United States, with over 7,000 stores across the country and in South America. The company only buys back shares of its own stock and does not pay dividends to shareholders.
It has reduced its number of shares outstanding by 87% over the past 20 years. Its PAT has grown at a CAGR of 10%, but its earnings per share (EPS) has grown at a much faster rate of 21% due to the share buyback. As a result, its total return per share has also tracked closely with the EPS growth at a CAGR of 21%.
Union Pacific
Union Pacific Is the second-largest railroad in the United States. It generally pays out 1/3 as dividend and 2/3 through share buyback. It has reduced share outstanding by 38%. Its PAT has also grown at 10% CAGR like Autozone. Its EPS has grown at a faster rate of 12% due to the buyback. As a result, it has delivered a total return per share of 15% per annum.
Vtech
VTech is a Hong Kong-based supplier of electronic learning products for kids, and it also provides outsourced electronic manufacturing services. It pays out 90% of its profits to shareholders in dividends, and the number of shares outstanding has remained flat over the past 20 years. Its PAT has grown at a CAGR of 12%, which is faster than AutoZone's 10% CAGR growth. VTech's EPS has grown at a CAGR of 12%, which is the same as its PAT growth rate, since the number of shares outstanding has remained the same. As a result, VTech has delivered a total return per share with dividends reinvested of 16% CAGR, which is lower than AutoZone's 21% CAGR total return, despite VTech's higher PAT growth rate.
These three tables summarize what we have just discussed about AutoZone, Union Pacific, and VTech. AutoZone has delivered a total return per share of 7500%, or 21% CAGR, while its net income has grown at 10% per annum. Union Pacific has also grown net income at 10% per annum and delivered a total return per share of 2600%, or 15% per annum. VTech has the highest net income growth rate with around 2200% of total return per share since 2001.
What really is Share buyback?
Share buyback is not a silver bullet, it does not automatically make capital allocation decision sensible. It only works if share is bought back at undervalued prices. The key reason to consider share buyback is that it serves as a benchmark in guiding capital allocation decisions towards maximizing long term shareholders value.
Additionally, it sends a clear signal to the market that the management will do the right thing when share price is undervalued. This can help to shape investors' perception of the company in a positive way over the long term.
What does share buyback do?
To quote Jeremy Grantham,
“When a company is buying back its share, it is effectively saying, who is the least enthusiastic about my company? You give him cash and take his eager stock back. You are constantly retiring the least enthusiastic shareholders and keep the rest who are naturally longer term.”
All markets and industries go through cycles of optimism and pessimism, high valuations and low valuations. Companies that think long-term buy back their shares when they are undervalued.
By the time the market reverses, some companies would use its shares as an expensive currency to carry out public / private market arbitrage. This means issuing their expensive shares to buy asset in the in private market at a much lower valuation. One of best examples is a company called One of the best examples of this is a company called Teledyne, founded by Henry Singleton, whose story is told in the book The Outsider.
Public/private market arbitrage can work both ways. When the public company's share is expensive, you can use them as a currency to acquire cheap private assets. But there are also times when private assets are more expensive than public market assets. In these cases, you may want to consider selling some of your private assets or buying shares in other public companies or your own stock.
These kinds of opportunities arise from time to time. But if you are going to pursue them, you need to be opportunistic, act quickly, and be aggressive, just like you would when approaching a good M&A opportunity in a private transaction.
An illustration on the effect of sensible buyback
Let’s use Mega First (MFCB) as an example. This company that has been actively buying back its shares at a price that is much lower than their intrinsic value. The illustration above is just a mathematical example of the effect of share buybacks. We are not suggesting that this is what the management of MFCB is doing or will do.
Currently, MFCB is almost in a net cash position. FY2023 core profit is expected to reach RM400m, and this may grow further towards RM550m within 3 years. Free-cash-flow generation is around RM480m after adding back the amortization of intangible asset. Its P/E ratio is 7.7x with an EPS of 42 cents.
If MFCB buys back 10% of its shares at the current price, its EPS would go up by 7%. If it buys back 50% of its shares, its EPS would go up by 61% to 68 cents, due to the decrease in shares outstanding. If the P/E ratio stays at 7.7x, the share price would also go up by 66% to RM5.29. However, it is important to note that companies that carry out such aggressive share buybacks will invariably push up their P/E ratios, as investor perception towards the company changes.
The intrinsic value per share is what guide your action. this is the number that tells us whether the buyback is sensible or not. If you purchase the share below its intrinsic value, it leaves the remaining shares a lot more valuable and increases intrinsic value per share as in this example.
Notes and Disclaimers
This essay and the information contained herein is not a specific offer of products or services. Information on this essay is not an offer to buy or sell, or a solicitation of any offer to buy or sell the securities mentioned herein.
Oaklands Path may be long or short the securities mentioned herein and has no duty or obligation to disclose or update our action on these securities.
This essay contains information and views as of the date indicated and such information and views are subject to change without notice. We have no duty or obligation to update the information contained herein. Further, we make no representation, and it should not be assumed, that past investment performance is an indication of future results. Moreover, wherever there is the potential for profit there is also the possibility of loss.
Certain information contained herein concerning economic trends and performance is based on or derived from information provided by independent third-party sources. Although we obtain information contained in our newsletter from sources we believe to be reliable, we cannot guarantee its accuracy. Moreover, independent third-party sources cited in these materials are not making any representations or warranties regarding any information attributed to them and shall have no liability in connection with the use of such information in these materials.


